Measured Data
Specific Heat
Experiments for specific heat [J/(kg K)], or heat capacity, were conducted using a heat flow meter on unconditioned and dried samples at 10 °C, 20 °C, 30 °C and 40 °C.
Unconditioned
| Temperature (C) | Specific Heat Mean (J/kg-K) | Standard Deviation (J/kg-K) |
|---|---|---|
| 10.0 | 1392.0 | 16.0 |
| 20.0 | 1430.0 | 32.0 |
| 30.0 | 1528.0 | 17.0 |
| 40.0 | 1569.0 | 24.0 |
Dried
| Temperature (C) | Specific Heat Mean (J/kg-K) | Standard Deviation (J/kg-K) |
|---|---|---|
| 10.0 | 1116.0 | 21.0 |
| 20.0 | 1164.0 | 18.0 |
| 30.0 | 1216.0 | 23.0 |
| 40.0 | 1266.0 | 21.0 |
Thermal Conductivity
Experiments for thermal conductivity [W/(m K)] were conducted using a heat flow meter on unconditioned and dried samples at 15 °C and either 45 °C or 65 °C.
Unconditioned
| Temperature (C) | Conductivity Mean (W/m-K) | Standard Deviation (W/m-K) |
|---|---|---|
| 15.0 | 0.138 | 0.003 |
| 45.0 | 0.147 | 0.003 |
Dried
| Temperature (C) | Conductivity Mean (W/m-K) | Standard Deviation (W/m-K) |
|---|---|---|
| 15.0 | 0.123 | 0.003 |
| 45.0 | 0.129 | 0.003 |
Mass Loss Rate (MLR)
Initial-mass-normalized mass loss rate [1/s] was measured in the simultaneous thermal analyzer experiments at three heating rates: 3 K/min, 10 K/min, and 30 K/min and mass loss rate [g/s] in the cone calorimeter at three heat fluxes: 25 kW/m2, 50 kW/m2, and 75 kW/m2.
Cone Calorimeter Test Notes:
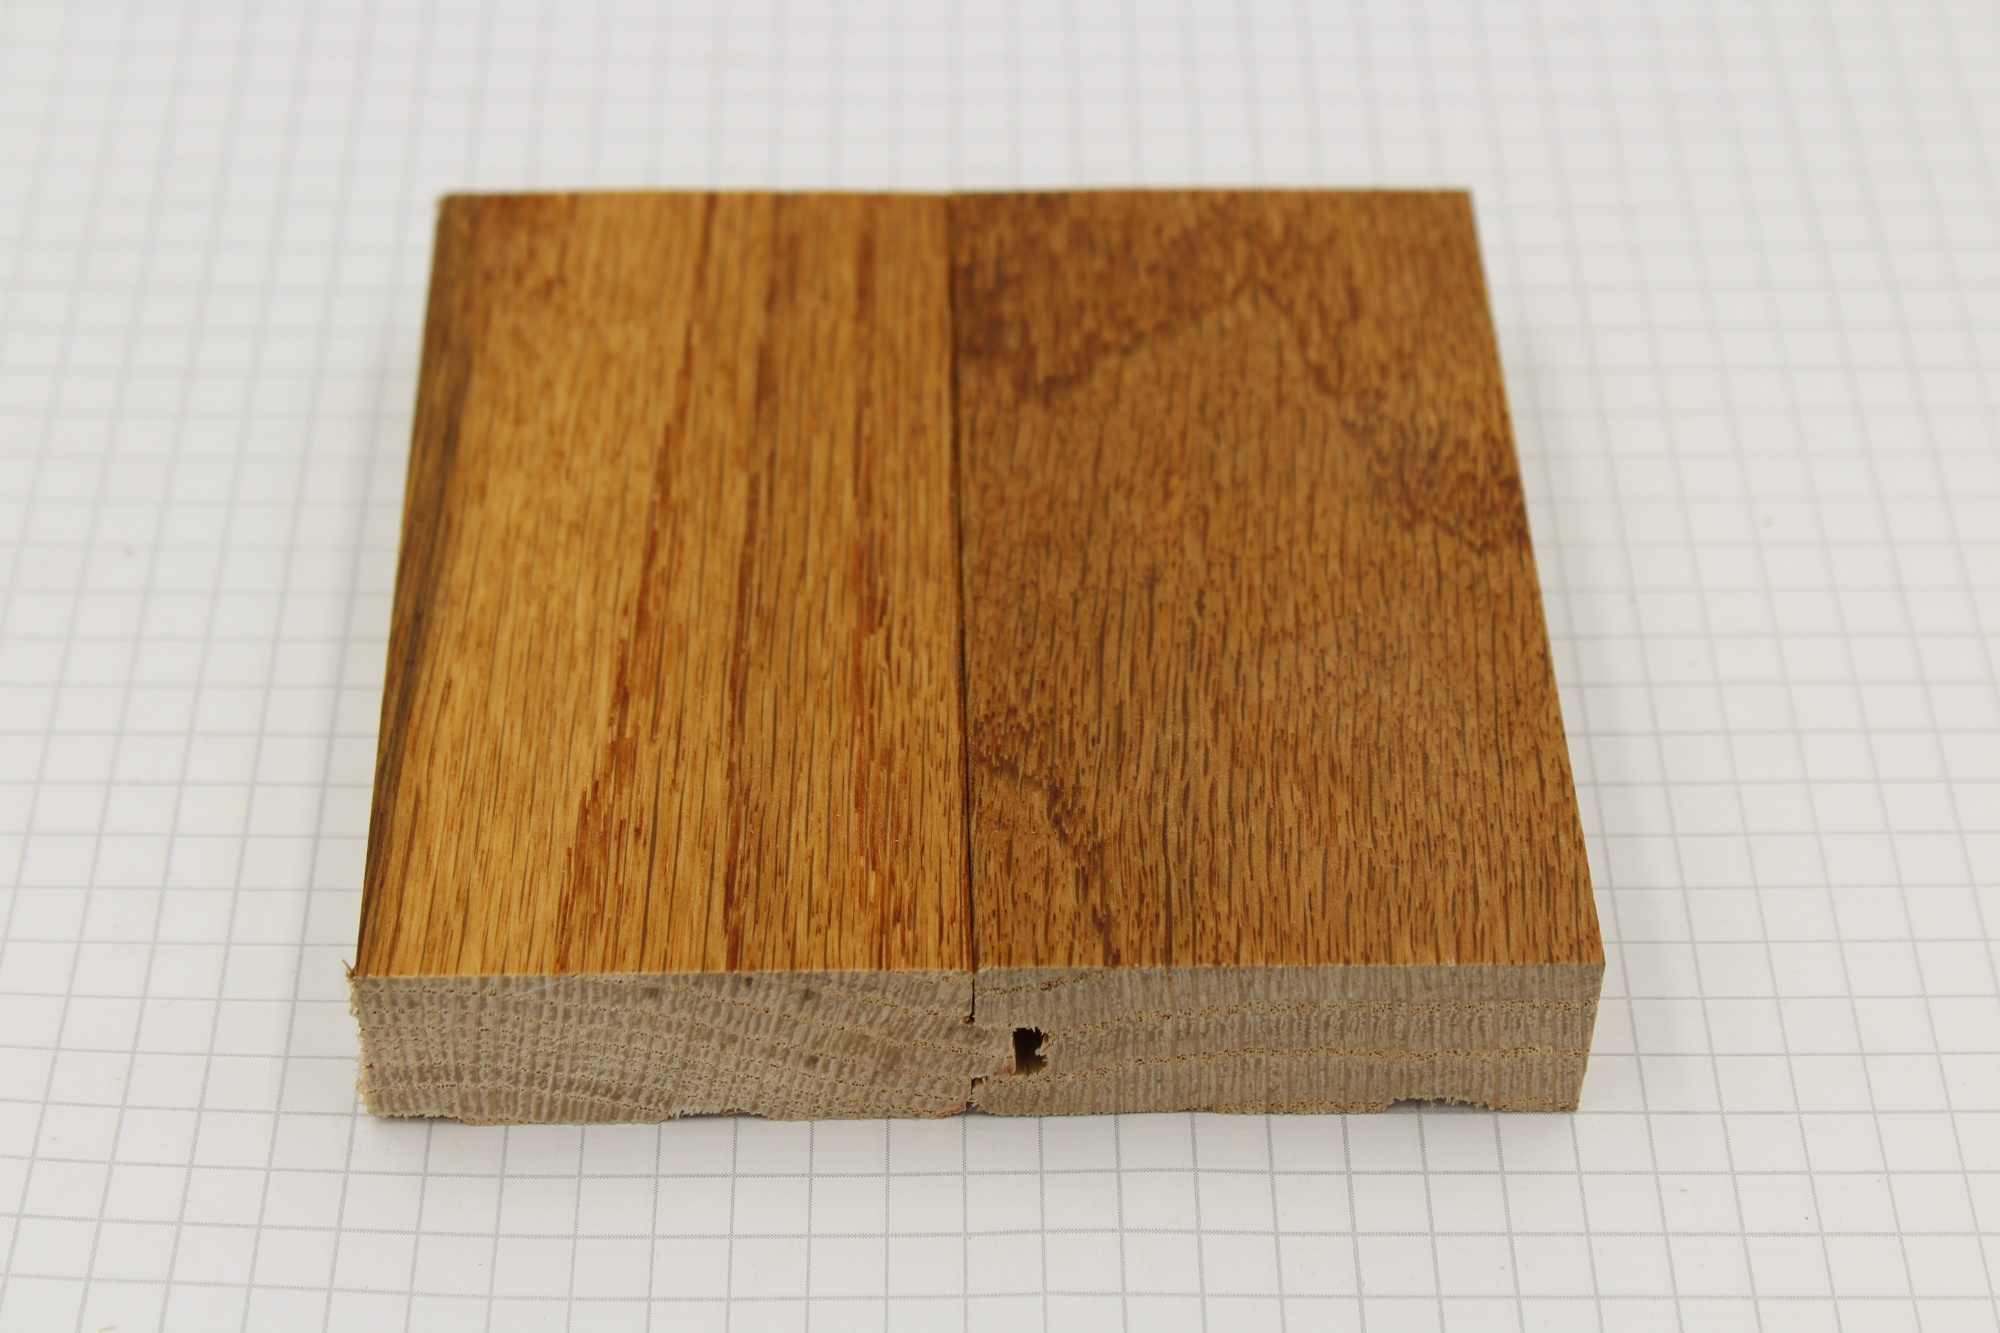
This material swells and warps into an arched shape during the fire's decay phase. This was observed in the first test (HF25_R1) and prevented in all subsequent tests by the use of tie wires. The source material is less wide than the required sample width for cone calorimeter tests, therefore each sample was comprised of two boards with the seam on center. Asymmetric burning and non-uniform post test conditions based on each half of the sample were observed in some tests, but no pattern has been determined. For individual test notes and select test pictures, follow the link above to Download raw data.
Simultaneous Thermal Analyzer
Cone Calorimeter: 25 kW/m2
Cone Calorimeter: 50 kW/m2
Cone Calorimeter: 75 kW/m2
Heat Release Rate Per Unit Area (HRRPUA)
Experiments for heat release per unit area [kW/m2] were conducted on samples conditioned at 20°C and 50% relative humidity using a cone calorimeter at three different heat fluxes: 25 kW/m2, 50 kW/m2, and 75 kW/m2.
This material swells and warps into an arched shape during the fire's decay phase. This was observed in the first test (HF25_R1) and prevented in all subsequent tests by the use of tie wires. The source material is less wide than the required sample width for cone calorimeter tests, therefore each sample was comprised of two boards with the seam on center. Asymmetric burning and non-uniform post test conditions based on each half of the sample were observed in some tests, but no pattern has been determined. For individual test notes and select test pictures, follow the link above to Download raw data.
Cone Calorimeter: 25 kW/m2
| 25 kW/m² R1 | 25 kW/m² R2 | 25 kW/m² R3 | 25 kW/m² R4 | |
|---|---|---|---|---|
| Time to Sustained Ignition (s) | 143.00 | 221.00 | 177.50 | 234.00 |
| Time to Peak HRRPUA (s) | 17.00 | 14.00 | 744.50 | 17.25 |
| Peak HRRPUA (kW/m²) | 312.06 | 234.58 | 268.79 | 271.61 |
Cone Calorimeter: 50 kW/m2
| 50 kW/m² R1 | 50 kW/m² R2 | 50 kW/m² R3 | |
|---|---|---|---|
| Time to Sustained Ignition (s) | 27.25 | 33.50 | 29.25 |
| Time to Peak HRRPUA (s) | 23.50 | 16.75 | 21.75 |
| Peak HRRPUA (kW/m²) | 299.33 | 331.46 | 320.39 |
Cone Calorimeter: 75 kW/m2
| 75 kW/m² R1 | 75 kW/m² R2 | 75 kW/m² R3 | |
|---|---|---|---|
| Time to Sustained Ignition (s) | 10.75 | 13.00 | 11.00 |
| Time to Peak HRRPUA (s) | 15.00 | 15.25 | 20.25 |
| Peak HRRPUA (kW/m²) | 435.05 | 436.17 | 428.74 |
Carbon Monoxide (CO) Yield
Carbon monoxide yield was measured during cone calorimeter experiments conducted at heat fluxes of 25 kW/m2, 50 kW/m2, and 75 kW/m2.
This material swells and warps into an arched shape during the fire's decay phase. This was observed in the first test (HF25_R1) and prevented in all subsequent tests by the use of tie wires. The source material is less wide than the required sample width for cone calorimeter tests, therefore each sample was comprised of two boards with the seam on center. Asymmetric burning and non-uniform post test conditions based on each half of the sample were observed in some tests, but no pattern has been determined. For individual test notes and select test pictures, follow the link above to Download raw data.
| Incident Heat Flux [kW/m²] | Mean CO Yield [g/g] | CO Yield Std. Dev. [g/g] |
|---|---|---|
| 25 | 0.009 | 0.001 |
| 50 | 0.004 | 0.001 |
| 75 | 0.004 | 0.0 |
Specific Heat Release Rate
Experiments for specific heat release rate [W/g], were conducted using a micro-scale combustion calorimeter at a heating rate of 30 K/min.
Derived Data
Soot Yield
Soot yield [g/g] was calculated from smoke obscuration data collected in cone calorimeter experiments conducted at heat fluxes of 25 kW/m2, 50 kW/m2, and 75 kW/m2.
This material swells and warps into an arched shape during the fire's decay phase. This was observed in the first test (HF25_R1) and prevented in all subsequent tests by the use of tie wires. The source material is less wide than the required sample width for cone calorimeter tests, therefore each sample was comprised of two boards with the seam on center. Asymmetric burning and non-uniform post test conditions based on each half of the sample were observed in some tests, but no pattern has been determined. For individual test notes and select test pictures, follow the link above to Download raw data.
| Incident Heat Flux [kW/m²] | Mean Soot Yield [g/g] | Soot Yield Std. Dev. [g/g] |
|---|---|---|
| 25 | 0.001 | 0.001 |
| 50 | 0.003 | 0.001 |
| 75 | 0.011 | 0.001 |
Effective Heat of Combustion (Δhc)
Effective heat of combustion [MJ/kg] is calculated from data collected in micro-scale combustion calorimeter experiments.
Micro-scale Combustion Calorimeter
| Value | R1 | R2 | R3 | Mean | Std. Dev. |
|---|---|---|---|---|---|
| Heat of Combustion (MJ/kg) | 12.31 | 13.38 | 11.15 | 12.28 | 0.91 |
Temperature at Onset of Decomposition
The temperature at onset of decomposition [Tonset] is a derived quantity computed from data collected in simultaneous thermal analyzer experiments.
| 3 °C/min | 10 °C/min | 30 °C/min | |
|---|---|---|---|
| Mean Onset Temperature (°C) | 212 | 230 | 248 |
| Std. Dev. Onset Temperature (°C) | NaN | 1 | 2 |
| Mean Normalized MLR at Onset (1/s) | 5.27e-04 | 4.92e-04 | 5.57e-04 |
| Std. Dev. Normalized MLR at Onset (1/s) | NaN | 0.01e-04 | 0.74e-04 |
| Mean Mass Fraction at Onset | 0.98 | 0.98 | 0.98 |
| Std. Dev. Mass Fraction at Onset | NaN | 0.00 | 0.00 |
| Mean Temperature at end of Decomposition (°C) | 420 | 443 | 459 |
| Std. Dev. Temperature at end of Decomposition (°C) | NaN | 2 | 2 |