Measured Data
Mass Loss Rate (MLR)
Initial-mass-normalized mass loss rate [1/s] was measured in the simultaneous thermal analyzer experiments at three heating rates: 3 K/min, 10 K/min, and 30 K/min and mass loss rate [g/s] in the cone calorimeter at three heat fluxes: 25 kW/m2, 50 kW/m2, and 75 kW/m2.
Cone Calorimeter Test Notes:
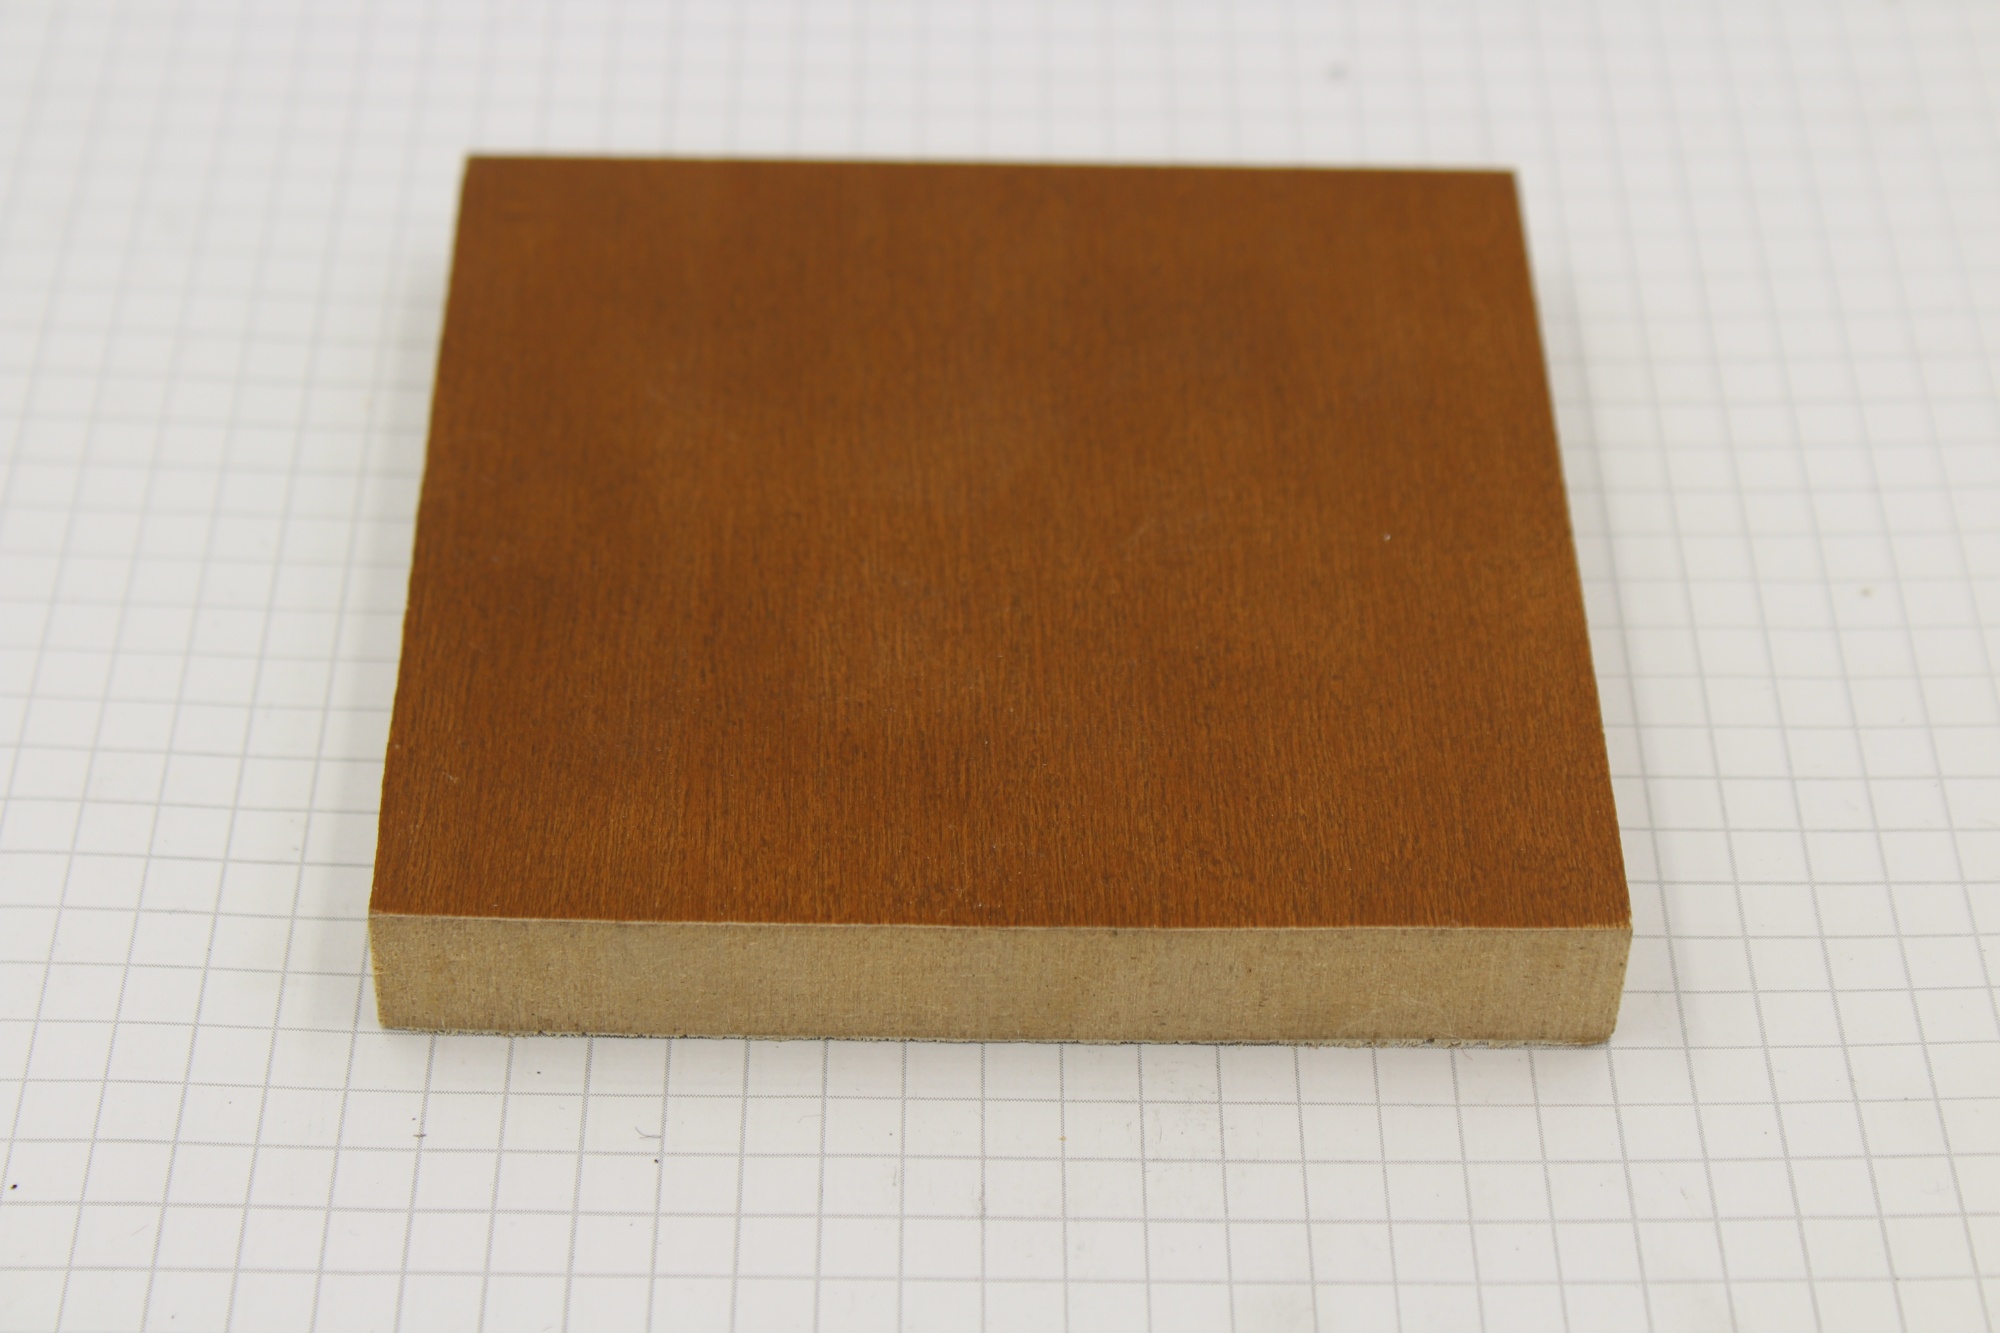
In tests HF25_R1 and HF25_R2 a bubble formed between the veneer and the MDF after ignition, which deflated shortly thereafter and released a brief horizontal flame jet from the edge of the sample.
This material forms cracks while burning and warps into an arched shape during the fire decay phase. A representative test picture is available at the link above to Download raw data. Additional replicates or alternative sample preparation (i.e. tie wire method) may be necessary to supplement this data set.
Simultaneous Thermal Analyzer
Cone Calorimeter: 25 kW/m2
Cone Calorimeter: 50 kW/m2
Cone Calorimeter: 75 kW/m2
Heat Release Rate Per Unit Area (HRRPUA)
Experiments for heat release per unit area [kW/m2] were conducted on samples conditioned at 20°C and 50% relative humidity using a cone calorimeter at three different heat fluxes: 25 kW/m2, 50 kW/m2, and 75 kW/m2.
In tests HF25_R1 and HF25_R2 a bubble formed between the veneer and the MDF after ignition, which deflated shortly thereafter and released a brief horizontal flame jet from the edge of the sample.
This material forms cracks while burning and warps into an arched shape during the fire decay phase. A representative test picture is available at the link above to Download raw data. Additional replicates or alternative sample preparation (i.e. tie wire method) may be necessary to supplement this data set.
Cone Calorimeter: 25 kW/m2
| 25 kW/m² R1 | 25 kW/m² R2 | 25 kW/m² R3 | |
|---|---|---|---|
| Time to Sustained Ignition (s) | 118.25 | 88.00 | 116.25 |
| Time to Peak HRRPUA (s) | 10.50 | 12.25 | 12.00 |
| Peak HRRPUA (kW/m²) | 291.97 | 261.06 | 303.30 |
Cone Calorimeter: 50 kW/m2
| 50 kW/m² R1 | 50 kW/m² R2 | 50 kW/m² R3 | |
|---|---|---|---|
| Time to Sustained Ignition (s) | 22.75 | 28.75 | 16.75 |
| Time to Peak HRRPUA (s) | 11.00 | 13.50 | 14.75 |
| Peak HRRPUA (kW/m²) | 505.19 | 514.26 | 457.22 |
Cone Calorimeter: 75 kW/m2
| 75 kW/m² R1 | 75 kW/m² R2 | 75 kW/m² R3 | |
|---|---|---|---|
| Time to Sustained Ignition (s) | 10.25 | 11.75 | 7.00 |
| Time to Peak HRRPUA (s) | 27.00 | 10.25 | 12.75 |
| Peak HRRPUA (kW/m²) | 492.13 | 627.54 | 547.54 |
Carbon Monoxide (CO) Yield
Carbon monoxide yield was measured during cone calorimeter experiments conducted at heat fluxes of 25 kW/m2, 50 kW/m2, and 75 kW/m2.
In tests HF25_R1 and HF25_R2 a bubble formed between the veneer and the MDF after ignition, which deflated shortly thereafter and released a brief horizontal flame jet from the edge of the sample.
This material forms cracks while burning and warps into an arched shape during the fire decay phase. A representative test picture is available at the link above to Download raw data. Additional replicates or alternative sample preparation (i.e. tie wire method) may be necessary to supplement this data set.
| Incident Heat Flux [kW/m²] | Mean CO Yield [g/g] | CO Yield Std. Dev. [g/g] |
|---|---|---|
| 25 | 0.012 | 0.001 |
| 50 | 0.006 | 0.0 |
| 75 | 0.007 | 0.0 |
Specific Heat Release Rate
Experiments for specific heat release rate [W/g], were conducted using a micro-scale combustion calorimeter at a heating rate of 30 K/min.
Derived Data
Effective Heat of Combustion (Δhc)
Effective heat of combustion [MJ/kg] is calculated from data collected in micro-scale combustion calorimeter experiments.
Micro-scale Combustion Calorimeter
| Value | R1 | R2 | R3 | Mean | Std. Dev. |
|---|---|---|---|---|---|
| Heat of Combustion (MJ/kg) | 12.27 | 12.2 | 12.2 | 12.22 | 0.03 |
Temperature at Onset of Decomposition
The temperature at onset of decomposition [Tonset] is a derived quantity computed from data collected in simultaneous thermal analyzer experiments.
| 3 °C/min | 10 °C/min | 30 °C/min | |
|---|---|---|---|
| Mean Onset Temperature (°C) | 175 | 188 | 208 |
| Std. Dev. Onset Temperature (°C) | NaN | 2 | 3 |
| Mean Normalized MLR at Onset (1/s) | 4.46e-04 | 4.20e-04 | 5.21e-04 |
| Std. Dev. Normalized MLR at Onset (1/s) | NaN | 0.14e-04 | 0.42e-04 |
| Mean Mass Fraction at Onset | 0.98 | 0.98 | 0.99 |
| Std. Dev. Mass Fraction at Onset | NaN | 0.00 | 0.00 |
| Mean Temperature at end of Decomposition (°C) | 446 | 470 | 493 |
| Std. Dev. Temperature at end of Decomposition (°C) | NaN | 8 | 10 |
Band Averaged Emissivity
Band averaged emissivity was calculated from reflectance measurements conducted with an integrating sphere and Fourier transform infrared spectrometer.
| Source Temperature [K] | Emissivity | Std. Dev. |
|---|---|---|
| 600.0 | 0.948 | 0.001 |
| 800.0 | 0.941 | 0.001 |
| 1000.0 | 0.932 | 0.002 |
| 1200.0 | 0.923 | 0.002 |
| 1400.0 | 0.915 | 0.003 |
| 1600.0 | 0.908 | 0.004 |
| 1800.0 | 0.902 | 0.004 |
| 2000.0 | 0.897 | 0.005 |